

From dictionaries to AI: a new era in sentiment analysis for financial stability
Prepared by John Fell, Sándor Gardó, Domenic Kellner, Benjamin Klaus, Jan Hannes Lang, Lukas Nagy, Pucho Vendrell, Marek Rusnák, Jonas Wendelborn and Stefan Wredenborg
Published as part of the Financial Stability Review, May 2026.
Financial stability communication is challenging because its task is not to forecast financial crises, let alone predict their precise timing. Rather, it is to identify vulnerabilities and explain how the financial system is likely to fare should it be confronted with adverse shocks. Great care is needed in this endeavour, because the sentiment of financial stability communication can influence market perceptions and risk assessments, as well as broader economic and financial outcomes. Given the presence of this potential feedback loop, the task of financial stability communication at the ECB has long been guided by a broad concept of financial stability: the smooth allocation of financial resources, effective management of risk by financial institutions and the capacity of the financial system to absorb shocks. Using the messages conveyed in the ECB’s Financial Stability Review over two decades, this special feature compares dictionary-based, FinBERT and prompt-based AI approaches to extracting financial stability sentiment. It finds broad co-movement across methods, while the GPT-based filter isolates sentences that contain explicit risk assessments, capturing subtle shifts in tone and context that were previously difficult to quantify. Used carefully, such tools can support risk monitoring and drafting consistency over time, but they remain complementary to expert judgement, vulnerability analysis and stress testing, rather than substitutes for it. A deep-dive box in the special feature also shows how AI can be used to systematically extract information from financial news to create an indicator for the severity and probability of triggers (SPOT) for financial stability risks.
1 Introduction
ECB communication on financial stability has long been organised around a broad analytical framework. In that framework, a financial system is stable when it supports the smooth and efficient allocation of financial resources, when financial institutions manage their risks effectively, and when the system can absorb adverse shocks and surprises.[1] Financial stability reviews (FSRs) are important vehicles used by central banks to communicate judgements of this type. But this form of communication is inherently challenging: it is not economic forecasting and it should not be judged as if it were. An FSR may appear to have been wrong ex post because a shock never materialised, because vulnerabilities unwound more gradually than expected, or because preventive action was taken. Given this complexity, a more realistic ambition would be to identify vulnerabilities and explain the type of shocks which might test the stability of the system, rather than to predict the exact trigger or timing of stress. That said, the language and tone central banks use in financial stability communication can play an important role in shaping market perceptions and influencing risk assessments. Ultimately, this can affect economic and financial outcomes.[2] Because of this, monitoring sentiment in FSRs can play a valuable role. This has long been done with sentiment metrics, which offer a structured perspective on how vulnerabilities and resilience are characterised over time. Now, with recent advances in artificial intelligence (AI) and especially large language models, the door has been opened to a more nuanced and adaptive form of sentiment analysis, overcoming some of the limitations of more traditional approaches such as survey-based and market-based methods.
This special feature explores how these methods can be used to extract and interpret financial stability sentiment. Section 2 sets out the three text-based approaches and clarifies the different objects they capture. Section 3 examines how ECB FSR communication has become more concise, more focused on assessment and more forward-looking over time. Section 4 relates the sentiment indicators to systemic stress and shows how they can complement vulnerability monitoring. Section 5 discusses practical applications in drafting and internal risk monitoring, and Section 6 concludes.
2 Measuring financial stability sentiment in ECB FSRs
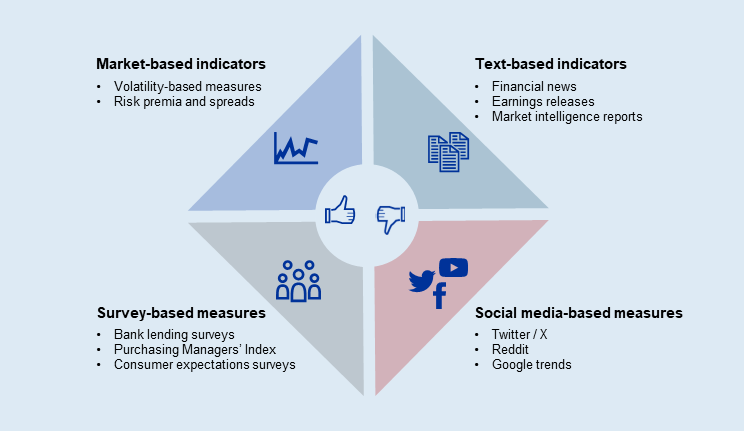
There is a range of quantitative approaches employed to measure sentiment relevant to financial stability, each with its own strengths and limitations. These approaches can be grouped into four broad categories (Figure A.1). First, market-based indicators are derived from asset prices and offer valuable high-frequency signals from financial markets. However, they often capture a complex interplay of factors, such as risk appetite, liquidity conditions and expectations, which are difficult to disentangle. Second, survey-based approaches capture expert judgement directly and offer rich qualitative insights, but are costly to administer and difficult to backfill historically. Third, social media-based approaches extract insights from trending topics on social media platforms or search trends to gauge public sentiment in real time. However, they are prone to “noise”, biased content, representation issues and manipulation risks that can skew sentiment analysis results. Finally, text-based analyses systematically extract sentiment from existing publications (e.g. earnings releases, financial news or commentaries from market analysts) over extended periods of time, eliminating the need for additional data collection.
Figure A.1
Various quantitative approaches can be employed to extract and evaluate sentiment metrics relevant for financial stability
Source: ECB.
Text-based methods, which are advancing rapidly through the growing use of AI, offer a valuable means of gauging financial stability sentiment. Within this evolving field, three distinct methodologies for analysing textual data stand out: (1) dictionary-based word counting, which measures linguistic tone using pre-defined word lists; (2) transformer-based neural classification, such as FinBERT, which classifies sentence-level tone in context; and (3) prompt-based generative-AI classification, which can be instructed to identify whether a sentence contains an explicit financial stability assessment and, if so, the direction of this assessment. These approaches differ not only in sophistication but also in the object being measured, so they are best treated as complementary than as substitutes, allowing cross-checks against one another, thereby making sentiment analysis more robust and reliable (Table A.1).
Table A.1
Overview of the strengths and limitations of various text-based methods used to measure financial stability sentiment
Approach |
Strengths |
Limitations |
|---|---|---|
Dictionary-based models |
Simple, need no model training or external application programming interface (API), produce deterministic results |
Context blind |
Transformer-based neural classification models |
Context aware, capture sentence-level nuance, adaptable to specific domains through fine-tuning |
Require labelled data and fine-tuning, opaque decision-making, resource intensive |
Generative AI-based models |
Flexible task instructions; can combine relevance, time-orientation and risk-direction classification with few-shot examples |
Non-deterministic outputs, often dependent on external APIs, sensitive to prompt/model settings, potentially expensive |
Source: ECB.
Text-based methodologies are also useful for assessing the sentiment of a central banks’ own financial stability communication over time. To obtain a comprehensive view of sentiment embedded in the ECB FSR, the three text-based methods discussed above are applied to the full corpus of 43 issues of the ECB FSR published between 2004 and 2025. This made it possible to systematically analyse textual data tracking sources of risk and vulnerabilities to financial stability, revealing sentiment trends and shifts over time.
Traditional dictionary-based methods offer a transparent and fully reproducible baseline for sentiment measurement. The approach relies on matching individual words in the text against pre-defined lists of positive and negative terms. The analysis of the text of the ECB FSRs follows the same approach as for the Fed financial stability dictionary created by Correa et al.[3], which comprises 391 terms (96 positive and 295 negative) curated on the basis of financial stability communication. All sentences are tokenised for each edition of the ECB FSR and, after stopwords have been removed, the remaining tokens are matched against the dictionary.[4] Net sentiment is then calculated as the difference between negative and positive word shares. The main advantage of this method is its simplicity: it requires no model training, no API and produces deterministic results. Its main limitation is its context blindness: it cannot distinguish, for instance, between “the contraction is deepening” and “the contraction is easing” since both sentences contain the same word flagged as a negative (i.e. contraction).
Transformer-based models address the context blindness of dictionaries by classifying sentiment at the sentence level. The standard BERT model[5] is a multi-layer neural network designed to understand the meaning of words on the basis of the context in which they appear. The FinBERT model used in this special feature is a BERT model pre-trained on financial news from Reuters and fine-tuned on the Financial PhraseBank, a corpus of roughly 4,800 sentences with human-annotated sentiment labels. Each sentence receives a probability distribution across three categories (positive, negative and neutral) and the highest-probability class is assigned as the hard label. As FinBERT processes the full sentence, it can capture negation, qualification and clause-level structure that word-counting methods miss. FinBERT was trained on economic/financial news rather than central bank language and is applied here without further tailoring to FSR vocabulary. But its independence from the specific text being analysed makes it a useful tool for cross-checking the robustness of sentiment patterns identified by other methods.
Generative AI models combine sentiment classification with structured reasoning about relevance to financial stability and temporal orientation. Unlike BERT models, the generative pre-trained transformer (GPT) method can evaluate complex relationships such as relevance for financial stability and time orientation within an integrated multi-step reasoning framework. In this special feature, the GPT method is employed by designing a prompt that encodes a three-step decision process.[6] The model first determines whether a sentence conveys a view on financial stability risk (an “assessment-bearing” filter).[7] Next, it classifies its temporal orientation (backward-looking, forward-looking or mixed)[8] and then, finally, it assigns a sentiment label (negative, neutral or positive: framed as the direction of financial stability risk).[9] The resulting series should thus be understood as a tailored measure of explicit risk judgements in the text, rather than as a formal benchmark of model accuracy. Crucially, sentiment is defined not as the general tone of the language but as the implied direction of financial stability risks and vulnerabilities. The label “negative” denotes higher or deteriorating risk, “positive” denotes lower or improving risk, and “neutral” applies where the assessment is balanced or implies no clear direction.
Harmonised summary sentiment scores can then be constructed from the three approaches. At the ECB FSR edition level, each method is aggregated into shares of negative, neutral and positive classifications of sentences (or word matches in the case of the dictionary) and net sentiment is defined as the difference between negative and positive shares. The score ranges from minus one to plus one. This provides a common summary metric for comparing directional patterns across methods, while keeping in mind that the underlying concepts are not identical.
3 Evolving sentiment of financial stability communication
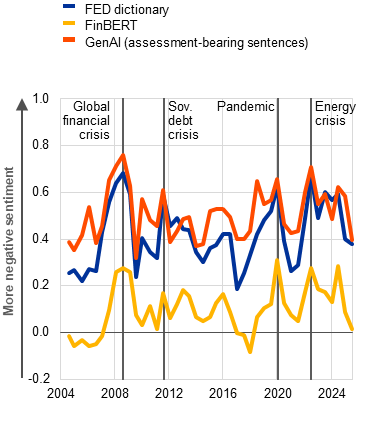
Financial stability sentiment metrics are broadly consistent across methods. Comparing net sentiment scores across the three methods allows robustness to be checked, revealing similar patterns (Chart A.1, panel a). The time series are highly correlated across methods: the dictionary and generative AI series show a correlation of 0.82, generative AI and FinBERT a correlation of 0.73 and the dictionary and FinBERT a correlation of 0.84. This three-way agreement suggests that the three approaches capture similar cyclical shifts in the ECB’s communication over time, even though they are not measuring exactly the same object: the dictionary and FinBERT series are closer to linguistic tone, while the GPT-based series is designed to capture the direction of risk assessments.
Chart A.1
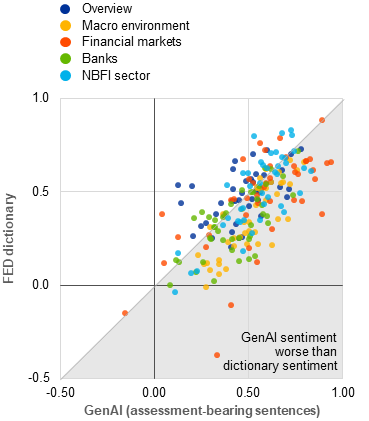
Different sentiment analysis methods broadly align, with the assessment-bearing GPT measure producing a sharper signal during stress episodes
a) Net ECB FSR sentiment over time, by method |
b) Net ECB FSR sentiment, by method and chapter |
|---|---|
(Dec. 2004-Nov. 2025, scores) |
(Dec. 2004-Nov. 2025, scores) |
 |
 |
Sources: ECB and ECB calculations.
Notes: GenAI stands for generative AI. Panel b: NBFI stands for non-bank financial intermediation.
Where the methods diverge, the differences are in themselves informative. The generative AI approach tends to produce more negative sentiment, including sharper peaks during crisis episodes, because the assessment-bearing filter concentrates the signal on sentences that carry explicit risk judgement. Notably, it signals a higher level of risk in the run-up to the global financial crisis than the other two methods. The dictionary and FinBERT methods, on the other hand, dilute the signal by considering all text, including more descriptive passages. Moreover, the level of sentiment produced by the FinBERT model tends to be more neutral than it is for the other two methods. This is because the model was trained on financial news, which typically features more emotionally charged language, whereas the ECB FSR employs a more restrained and formal tone. While this makes the GPT-based series a closer proxy for explicit risk assessments in the text, it does not necessarily make it a demonstrated benchmark of superior accuracy. The more negative sentiment produced using the generative AI approach can be seen as a reflection of the ECB FSR’s focus on downside risks. At the same time, a somewhat less volatile series is produced by this method in comparison with the dictionary approach.
Calculating sentiment scores at the chapter level makes it possible to compare risk assessments across sectors. While the structure of the ECB FSR has evolved over time, the overall coverage of topics has remained the same. Each ECB FSR features an Overview that summarises the risk assessment, as well as sections on the macro-financial and credit environment, financial markets, the euro area banking sector and the euro area non-bank financial sector. While, on average, the generative AI approach produces more negative scores at chapter level, this is not consistently the case for the whole body of the ECB FSR (Chart A.1, panel b). Notably, for individual chapters there are several outliers where the generative AI approach arrives at much lower or much higher sentiment scores than the dictionary, indicating periods in which the dictionary is prone to dilution. In addition, the differing variance of sentiment scores across chapters points towards structural differences between their subject topics. The assessment of financial markets shows the greatest variance in sentiment scores, reflecting the higher volatility of markets compared with, for instance, the real economy.
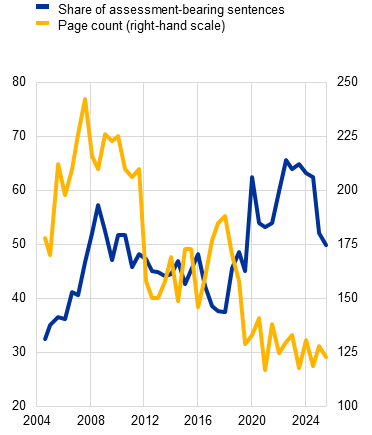
The share of assessment-bearing sentences has trended upwards over time, reflecting shifts in central bank communication. On average, around half of ECB FSR sentences are classified as “assessment-bearing”, providing an explicit judgement on financial stability (Chart A.2, panel a). Over time, this share has changed substantially, with a pronounced increase seen since the end of 2018. The share of assessment-bearing sentences was particularly low for issues which had a high page count, indicating that the additional length came mostly from more descriptive passages. This partly reflects structural changes made to the content of the ECB FSR, with earlier editions dedicating much more space to descriptions of international developments. However, the substantial shift to more concise editions and a higher share of assessment-bearing sentences since end-2018 is consistent with a more concise and more targeted communication style. Part of this shift reflected deliberate editorial choices, including responses to reader feedback,[10] while year-to-year movements still depend on the amount of contextual material needed to frame the risk assessment. Finally, while each ECB FSR undergoes a rigorous editing process, such trends can also be explained by changes in the editorial team, which can influence stylistic drafting choices.
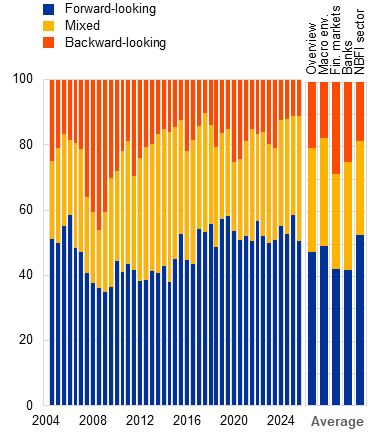
The temporal orientation of ECB FSR sentences has gradually adopted a more forward-looking perspective. Given that the ECB FSR’s objective is to warn about sources of risk and vulnerabilities, sentences tend to be forward-looking or have a mixed temporal orientation, meaning they balance forward-looking and backward-looking elements or contain contemporaneous statements (Chart A.2, panel b). Since its trough in 2009, the share of more forward-looking statements has gradually trended up and has stabilised at around 50%. On the other hand, the share of purely backward-looking statements is generally much lower. However, during or shortly after crisis episodes (depending on when the crisis materialised relative to the publication dates of the ECB FSR), backward-looking statements spike as an account is provided of the developments during the episode. There are also differences across chapters in this case, with the chapters on financial markets and on the banking sector generally having the greatest backward-looking orientation.
Chart A.2
Over time the ECB FSR has become shorter, more assessment-bearing and more forward-looking
a) Share of assessment-bearing sentences and page count |
b) Temporal orientation of sentences |
|---|---|
(Dec. 2004-Nov. 2025; percentages, total) |
(Dec. 2004-Nov. 2025, percentages) |
 |
 |
Sources: ECB and ECB calculations.
Note: Panel b: NBFI stands for non-bank financial intermediation.
4 Sentiment as a summary metric for financial stability risk assessments
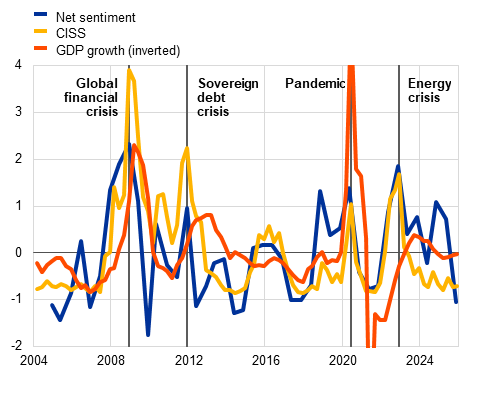
Sentiment embedded in the risk assessments articulated in ECB FSRs co-moves with systemic stress. Periods of acute financial turmoil tend to be associated with pronounced increases in systemic stress and marked shifts in ECB FSR sentiment (Chart A.3, panel a). In vulnerability-driven episodes, such as the global financial crisis and the sovereign debt crisis, heightened stress coincided with the materialisation of structural weaknesses in credit intermediation and sovereign balance sheets. By contrast, the COVID-19 pandemic shock originated outside the financial system but still prompted a sharp reassessment. Financial instability often arises when shocks meet vulnerabilities. Because the timing of shocks is inherently difficult – if not impossible – to predict precisely, financial stability communication does not seek to forecast them. It aims instead to identify the vulnerabilities that may amplify stress once shocks materialise and the kinds of shocks to which the system would be exposed (see Box A). The pandemic shock is the clearest illustration: its timing and form could not have been predicted, but some of the vulnerabilities it exposed had already been signalled. Sentiment therefore captures changes in the intensity of those communicated risk assessments. While it broadly co-moves with market stress, it does not simply mirror contemporaneous financial conditions and may also capture forward-looking evaluations of financial stability risks.
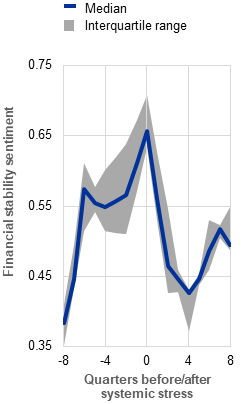
Chart A.3
ECB FSR sentiment co-moves with systemic stress and macroeconomic conditions
a) Net ECB FSR sentiment, Composite Indicator of Systemic Stress and GDP growth |
b) Net ECB FSR sentiment around crisis periods |
|---|---|
(Q1 2004-Q4 2025, z-scores) |
(net sentiment score) |
 |
 |
Sources: ECB and ECB calculations
Notes: The Composite Indicator of Systemic Stress (CISS) is aggregated from daily to quarterly frequency by taking the arithmetic mean of all daily observations within each quarter. For details of the CISS, see Holló et al.* Panel b: semi-annual sentiment is linearly interpolated to quarterly frequency. The chart shows the respective sentiment metric in the quarters before and after episodes of systemic stress. The blue line shows the median and the shaded band the interquartile range across the selected stress episodes. Event time 0 marks the quarter of peak (systemic) stress as measured by the peak in the CISS. Only the first three episodes (global financial crisis, euro area sovereign debt crisis and COVID-19 pandemic) coincided with euro area recessions.
*) Holló, D., Kremer, M. and Lo Duca, M., “CISS – A composite indicator of systemic stress in the financial system”, Working Paper Series, No 1426, ECB, March 2012.
Sentiment also displays cyclical and mean-reverting dynamics that may be informative for vulnerability monitoring. There is a rise in sentiment ahead of systemic stress, followed by a decline and gradual normalisation (Chart A.3, panel b). The observed mean-reverting dynamics reflect shifts in financial stability communication. Around the height of the stress, assessments often emphasise stabilisation measures and resilience factors. As uncertainty declines, the narrative rebalances towards a focus on medium-term risks and structural vulnerabilities, contributing to the gradual decline in negative sentiment after the peak. Improvements in macro-financial conditions therefore shift the emphasis of risk assessments rather than eliminate the underlying vulnerabilities. From an early-warning perspective, monitoring the speed and extent of this mean reversion might help in the identification of phases in which favourable conditions coincide with the gradual build-up of new imbalances.
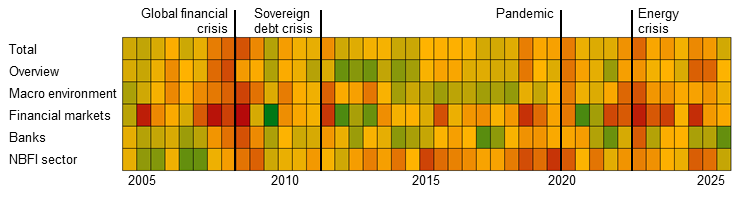
Sectoral sentiment patterns provide an additional insight into how systemic and sector-specific risks evolve over the cycle. Crisis episodes are associated with broadly elevated sentiment intensity across ECB FSR chapters, reflecting the system-wide nature of stress (Chart A.4). During such periods, assessments across macroeconomic conditions, financial markets, banks and non-bank financial institutions move up in tandem, signalling a generalised increase in risks. As stress recedes, sentiment moderates and becomes more differentiated across chapters. As a result, cyclical improvements in overall aggregate sentiment do not necessarily indicate a broad-based reduction in systemic risk. Instead, they may be masking persistent vulnerabilities in specific segments of the financial system.
Chart A.4
Sectoral sentiment dynamics highlight cyclical shifts in systemic risk assessments
Net sentiment scores across sector assessments
(Dec. 2004-Nov. 2025, net sentiment score)
Sources: ECB and ECB calculations.
Notes: Red indicates more negative sentiment, green more positive sentiment. NBFI stands for non-bank financial intermediation.
Box A
Using artificial intelligence to assess the severity and probability of triggers (SPOT) for financial stability risks
Financial stability risks comprise vulnerabilities and the potential triggers which could expose such vulnerabilities, but so far mainly qualitative methods have been used to assess triggers. As explained in previous editions of the ECB’s Financial Stability Review,[11] vulnerabilities are imbalances or fault lines within the financial system or within non-financial sectors that can propagate or amplify shocks, whereas triggers are events that could unearth vulnerabilities or cause them to unravel in a disorderly manner. In recent years, considerable progress has been made in measuring vulnerabilities. Examples of vulnerability measures developed at the ECB include the Systemic Risk Indicator (SRI) and the corporate vulnerability indicator.[12] By contrast, measuring potential triggers has proven more difficult, partly because triggers can have a variety of sources including growth shocks, major policy changes, geopolitical events, wars and pandemics. For this reason, the methods used to assess potential triggers associated with financial stability risks are still mainly qualitative. This is an area in which recent advances in artificial intelligence (AI) could prove promising: newspaper articles often discuss potential trigger events and large language models (LLMs) could be used to extract this information systematically.
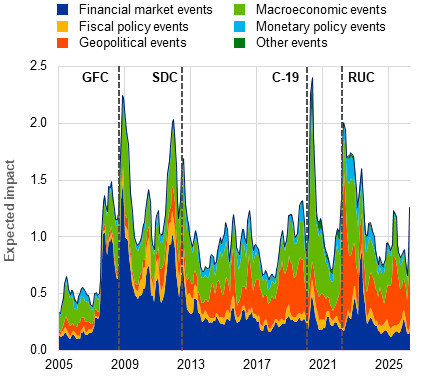
Recent research by ECB staff has used LLMs and financial news to construct a forward-looking indicator measuring the severity and probability of triggers (SPOT) associated with financial stability risks.[13] The proposed approach applies a structured three-stage prompting process to a large dataset of Financial Times articles from 2005 onwards.[14] The first prompt pre-filters the data to obtain a dataset of relevant articles that have a primary economic or financial focus. The second prompt is applied to this dataset. It classifies whether the articles signal a potential trigger event that could have a severely negative impact on the euro area economy or financial stability over a one-year horizon. Finally, the third prompt is applied to articles identified as signalling potential trigger events and assigns several attributes based on information contained in the articles. These are: the probability that a trigger event could materialise, the potential severity of its impact, the time horizon over which the trigger event is most likely to occur and the main source of the trigger event.[15] The benchmark SPOT indicator combines the frequency of articles covering trigger events at a given point in time with information about the potential severity of such trigger events and the probability of them occurring, to capture their overall expected impact. Moreover, the extracted attributes allow for decompositions of the benchmark SPOT indicator by trigger source, time horizon and risk characteristics.[16]
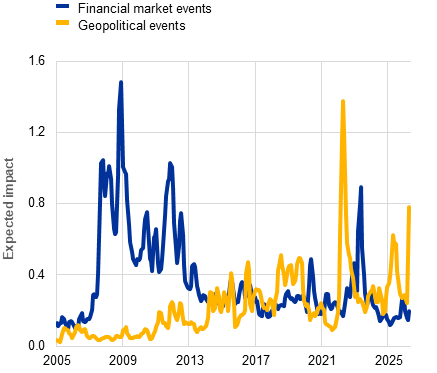
Chart A
The SPOT indicator increases ahead of major historical trigger events and makes it possible to identify different trigger sources
a) Decomposition of the benchmark SPOT indicator |
b) Examples of sectoral SPOT indicators |
|---|---|
(Jan. 2005-Apr. 2026, expected trigger impact across all articles) |
(Jan. 2005-Apr. 2026, expected geopolitical and financial market trigger impact across all articles) |
 |
 |
Sources: Textual analysis of Financial Times journalism and ECB calculations.
Notes: Indicators are shown as three-month moving averages. Panel a: the expected trigger impact is calculated as the average of probability*severity across all articles used in the second step of the prompting process. An article that is classified as not signalling a potential trigger event has probability*severity equal to zero. The black dashed lines indicate major events, including the global financial crisis (GFC), the euro area sovereign debt crisis (SDC), the COVID-19 pandemic (C-19) and the outbreak of the Russia-Ukraine conflict (RUC).
The SPOT indicator increases ahead of major historical trigger events and accurately identifies different trigger sources, making it a useful tool for monitoring financial stability risks. For example, the benchmark SPOT indicator reached peaks around the onset of the global financial crisis in 2008, the euro area sovereign debt crisis in 2011, the COVID-19 pandemic in 2020 and the Russian invasion of Ukraine in 2022 (Chart A, panel a). The decomposition of the benchmark SPOT indicator into trigger sources offers further insights into underlying drivers and helps form a risk narrative. For instance, financial market triggers dominated before and during the global financial crisis and the euro area sovereign debt crisis, while other exogenous triggers increased in importance during the COVID-19 pandemic (Chart A, panel a). More recently, geopolitical triggers spiked following Russia’s invasion of Ukraine in 2022, again in 2025 amid heightened geopolitical and trade tensions, and once more in 2026 due to the war in the Middle East. Sectoral SPOT indicators for individual trigger sources render these patterns even more visible and can be used to complement the benchmark SPOT indicator (Chart A, panel b). Overall, these patterns suggest that the proposed AI-based SPOT indicator can measure potential trigger events systematically and provide meaningful information about underlying drivers.
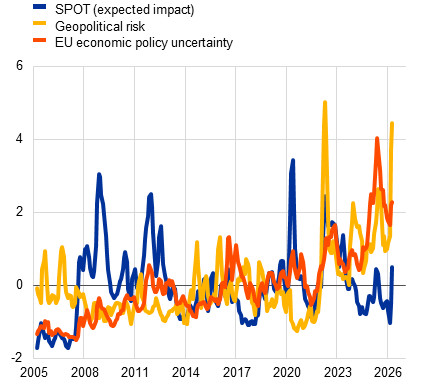
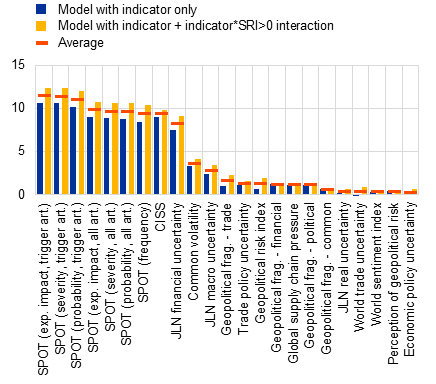
The SPOT indicator contains significant information about future downside risks to the economy, especially when combined with indicators that reflect underlying vulnerabilities. A comparison can be made between the SPOT indicator and established text-based risk indicators such as the geopolitical risk index (GPR) or the EU economic policy uncertainty index (EPU).[17] This reveals that the SPOT indicator identifies not only peaks similar to those for established indicators but also peaks related to potential trigger sources not captured by the narrower indicators (Chart B, panel a). Moreover, the amplitude of SPOT peaks can differ from other indicators, as the SPOT indicator explicitly incorporates information about the expected impact of a potential trigger on the economy and financial stability. Panel growth-at-risk model estimates for euro area countries show that various SPOT indicators add more information about future downside risks to the economy than other risk indicators suggested in the literature, such as the GPR, the EPU or the Composite Indicator of Systemic Stress (CISS) (Chart B, panel b).[18] The growth-at-risk model results also show that it is useful to combine information about the probability and severity of triggers, as SPOT indicators reflecting the expected impact (combining probability and severity) perform best. In addition, when SPOT indicators interact with measures of underlying vulnerabilities, the explanatory power for future downside risks to the economy increases further (yellow bars in Chart B, panel b). This suggests that while triggers act as immediate catalysts for stress, the differential impact on GDP tail risks is driven by pre-existing vulnerabilities. Hence, it is important to monitor vulnerabilities and the severity and probability of potential triggers jointly in order to form a holistic picture of financial stability risks.
Chart B
The SPOT indicator complements other existing risk indicators and helps to improve the early identification of downside risks to the economy
a) Comparison of SPOT and other text-based indicators |
b) Additional information content of various indicators for future downside GDP risks |
|---|---|
(Mar. 2005-Apr. 2026, z-scores) |
(percentages) |
 |
 |
Sources: Textual analysis of Financial Times journalism, Caldara and Iacoviello*, Baker et al.** and ECB calculations.
Notes: Panel a: indicators are shown as the three-month moving averages. Panel b: the benchmark growth-at-risk model includes current GDP growth and the Systemic Risk Indicator (SRI) (including its lag and a dummy variable for cases when SRI>0). The chart measures the percentage improvement in model fit (tick loss function) for the 10th percentile of annual real GDP growth one-year ahead relative to the benchmark model. The models are estimated for the panel of euro area countries from Q1 2005 to Q1 2024, including country fixed effects and pandemic period dummies. “exp. impact” stands for expected impact; “trigger art.” denotes articles that were classified as containing information about trigger events. JLN stands for Jurado et al.***; CISS stands for Composite Indicator of Systemic Stress; “Geopolitical frag.” stands for geopolitical fragmentation.
*) Caldara, D. and Iacoviello, M., “Measuring Geopolitical Risk”, American Economic Review, Vol. 112, No 4, April 2022, pp. 1194-1225
**) Baker, S.R., Bloom, N. and Davis, S.J., “Measuring Economic Policy Uncertainty”, The Quarterly Journal of Economics, Vol. 131, No 4, November 2016, pp. 1593-1636.
***) Jurado, K., Ludvigson, S.C. and Ng, S., “Measuring Uncertainty”, American Economic Review, Vol. 105, No 3, March 2015, pp. 1177-1216.
Overall, the results presented in this box suggest that AI-based signal extraction from text offers a promising avenue for enhancing the monitoring of financial stability risks. Recent research shows that machine learning and LLMs can be used to extract relevant information from unstructured data to construct indicators of sentiment, uncertainty and macro-financial risks.[19] Building on these advances, the SPOT indicator presented in this box demonstrates how LLMs applied to financial news can provide a systematic and interpretable measure of potential trigger events, thereby complementing existing vulnerability indicators used for monitoring financial stability risks. Looking ahead, a promising avenue would appear to be the application of similar approaches to new or previously underutilised data sources, including financial disclosures, supervisory information, market intelligence findings and social media posts.[20] While challenges related to model reliability, interpretability and data governance remain, AI-based approaches have the potential to become an important component of financial stability surveillance frameworks.
5 Practical applications for improving financial stability communication
Central bank communication on financial stability and systemic risks plays a key role in safeguarding financial stability. Financial stability communication is inextricably intertwined with financial stability analysis.[21] Effective communication forms an important part of crisis prevention by informing market participants’ risk assessments. These assessments, in turn, can bring about preventive action within the financial industry, strengthen market discipline and enhance the financial system’s resilience. Furthermore, financial stability communication helps central banks maintain transparency, ensuring they remain accountable as they fulfil their financial stability mandates.
Sentiment indicators can help in ensuring that financial stability assessments and communication are aligned. The output from risk identification and assessments is regularly communicated by central banks and other authorities through financial stability reports, among other formats. One use may be during the ECB FSR drafting cycle: a chapter-level dashboard can compare the sentiment of successive drafts with the risk rankings agreed in the underlying assessment process, flagging cases where the text has become materially more sanguine or more alarmist without a corresponding change in the analysis. This is especially important for ensuring that different parts of the text written by different authors are not unduly influenced by individual drafting styles and preferences. Any such influence could create perceived differences in assessments across different parts of reports and over time. A second use may be as a consistency check across chapters and publications: if related vulnerabilities are discussed in markedly different language or with a very different time orientation, editors can review whether the difference reflects substance or drafting style. In this setting, metrics on assessment-bearing sentences and temporal orientation are more defensible than claims about readability. Sentiment metrics can also be used to cross-check the tone of different types of communication within an institution or across institutions addressing similar topics. That said, where external LLMs are used on internal draft material, institutions also need clear governance on confidentiality, access controls, data retention and approved use cases.
6 Conclusion
To sum up, AI-based text analysis can enrich financial stability communication, but its contribution is best understood with some caution. Dictionary-based, FinBERT and GPT-based approaches show broadly similar cyclical patterns across two decades of ECB FSRs, even though they do not measure exactly the same concept. The GPT-based series is best understood as a tailored measure of explicit risk judgements in the text, not as a demonstrated accuracy benchmark. The evidence also points to a shorter, more assessment-bearing and more forward-looking ECB FSR. These tools can serve as useful cross-checks during drafting and monitoring of financial stability vulnerabilities, especially in a field where shocks are inherently difficult, if not impossible, to predict and where the central tasks are to identify vulnerabilities and assess shock-absorption capacity. As such, these new tools can complement − but not replace − expert judgement, vulnerability analysis and stress testing.
Legal Disclaimer:
EIN Presswire provides this news content "as is" without warranty of any kind. We do not accept any responsibility or liability for the accuracy, content, images, videos, licenses, completeness, legality, or reliability of the information contained in this article. If you have any complaints or copyright issues related to this article, kindly contact the author above.
